サーバー大好き、めぐみそです。
今回からなんとなくで各社のVPSをレビューする会をしてみたいと思ったので始めました。
第1回となる今回は、Linodeをレビューしてみます。
プラン
まずはプランの比較からしていきます。
基本的にはVPS、または専用サーバーとしてのもののみ掲載しています。(レンタルサーバーは含みません)
プランはこちらのものを掲載しています。
共有プラン
CPUを他のユーザーと共有する一般的なプランです。
| CPUコア数 | メモリ(GB) | ストレージ(GB) | 転送量(TB) | 価格()内は1時間 |
| 1 | 1GB | 25GB | 1TB | $5($0.01) |
| 1 | 2GB | 50GB | 2TB | $10($0.02) |
| 2 | 4GB | 80GB | 4TB | $20($0.03) |
| 4 | 8GB | 160GB | 5TB | $40($0.06) |
| 6 | 16GB | 320GB | 8TB | $80($0.12) |
| 8 | 32GB | 640GB | 16TB | $160($0.24) |
| 16 | 64GB | 1280GB | 20TB | $320($0.48) |
| 20 | 96GB | 1920GB | 20TB | $480($0.72) |
| 24 | 128GB | 2560GB | 20TB | $640($0.96) |
| 32 | 192GB | 3840GB | 20TB | $960($1.44) |
基本的にはメモリ(GB)x$5といった料金ですね。
CPUコア数が最も効率が良いのは1GBプラン。
ストレージ、転送量の効率が良いのは1GB、2GBプランのようです。
占有CPUプラン
CPUのみが占有に割り当てられるプランです。
| CPUコア数 | メモリ(GB) | ストレージ(GB) | 転送量(TB) | 価格()内は1時間 |
| 2 | 4GB | 80GB | 4TB | $30($0.05) |
| 4 | 8GB | 160GB | 5TB | $60($0.09) |
| 8 | 16GB | 320GB | 6TB | $120($0.18) |
| 16 | 32GB | 640GB | 7TB | $240($0.36) |
| 32 | 64GB | 1280GB | 8TB | $480($0.72) |
| 48 | 96GB | 1920GB | 9TB | $720($1.08) |
| 50 | 128GB | 2500GB | 10TB | $960($1.44) |
| 56 | 256GB | 5000GB | 11TB | $1920($2.88) |
| 64 | 512GB | 7200GB | 12TB | $3840($5.76) |
こちらはメモリ(GB)x$7.5の料金のようです。
メモリは大容量まで対応していますが、その分転送量があまり安くないように思えます。
大容量メモリプラン
メモリが大容量なのが売りのプランです。
ついでにCPUも占有のようです。
| CPUコア数 | メモリ(GB) | ストレージ(GB) | 転送量(TB) | 価格()内は1時間 |
| 2 | 24GB | 20GB | 5TB | $60($0.09) |
| 2 | 48GB | 40GB | 6TB | $120($0.18) |
| 4 | 90GB | 90GB | 7TB | $240($0.36) |
| 8 | 150GB | 200GB | 8TB | $480($0.72) |
| 16 | 300GB | 340GB | 9TB | $960($1.44) |
こちらはメモリと料金が一定の基準ではありませんが、最も効率が良いのは48GBプランのようです。
ただし、CPUコア数が少し少ないように感じるので、CPUがボトルネックにならないような使い方をするのが望ましいと感じます。
ストレージもやや少なめなので、どうしても必要であれば、ブロックストレージを使用するか、他のマシンからローカルネットワーク越しにストレージを使用する方が良さそうです。
GPU搭載プラン
専用の仮想マシンを用いて、RTX6000が搭載されたプランです。
| CPUコア数 | GPU搭載数 | メモリ(GB) | ストレージ | 転送量(TB) | 価格 |
| 8 | 1 | 32GB | 640GB | 16TB | $1000($1.50) |
| 16 | 2 | 64GB | 1280GB | 20TB | $2000($3.00) |
| 20 | 3 | 96GB | 1920GB | 20TB | $3000($4.50) |
| 24 | 4 | 128GB | 2560GB | 20TB | $4000($6.00) |
GPUが入ってる個数x$1000の料金のようです。あまり一般の方が使うことは想定していない価格だと思われます。
転送量
割り当てられた転送量を超過すると、1GBあたり$0.01かかるようです。しかしながら、下りの通信は無制限なので、上りだけ転送量としてカウントされます。
ただし、$5のプランで1TB通信でき、なおかつ転送量は共有されるので、足りなくなると思ったら新しいサーバーを借りてしまった方が安上がりとなります。
OS
OSとして、以下のものが用意されています。
・AlmaLinux8
・Alpine 3.14, 3.13, 3.12, 3.11, 3.10, 3.9
・Arch Linux
・CentOS 8,Stream 8, 7, 6.8
・Debian 11, 10, 9, 8
・Fedora 34, 33, 32, 31
・Gentoo
・Rocky Linux 8
・Slackware 14.2, 14.1
・Ubuntu 21.10, 21.04, 20.10, 20.04 LTS, 18.04 LTS, 16.04 LTS
・OpenSUSE Leap 15.3, 15.2, 15.1
Windows Serverは提供されていないようです。
サポートが切れてるような古いバージョンも選択可能なようですね。
所在地
アメリカ ニューアーク, ダラス, アトランタ, フリーモント
カナダ トロント
イギリス ロンドン
ドイツ フランクフルト
イント ムンバイ
オーストラリア シドニー
シンガポール シンガポール
日本 東京
日本でもVPSが提供されているようなので、安定して使えそうです。
特徴
DDoS保護を無料で提供している
Linodeでは、DDoS保護が標準で付いてくるようです。
日本ではなかなかみられないDDoS保護サービスなので、これだけでも契約する価値があるのではないかと思われます。
転送量がサーバー全体で共有
これは個人的にとても驚いたのですが、契約して手に入れた転送量は、契約しているサーバー全体で共有されます。
例えば、転送量が1TBと4TBのサーバーを契約していた場合、2つのサーバーで5TBまで合計して使えるということになります。
もしも1TBまでしか使えないはずのサーバーで2TB使ってしまっても、もう一方のサーバーが3TB以内に収まっていれば、追加料金を取られることはありません。
このようなシステムは他ではみたことがないため、Linode限定の機能だと思われます。
API搭載
APIが実装されているため、APIを通じてサーバーの操作を行うことができます。
開発者の方にとっては嬉しい機能なのではないでしょうか。
ローカルIP付与対応
サーバーにローカルIPを付与することができます。これにより、サーバー間をローカルで接続することができ、ローカルの接続の場合は、転送量は課金されません。
サーバー追加
いよいよサーバーを追加して操作してみます。
OSは Ubuntu Server 20.04 LTS
プランは共有CPUプラン、1GBを選択しています。
IPアドレス
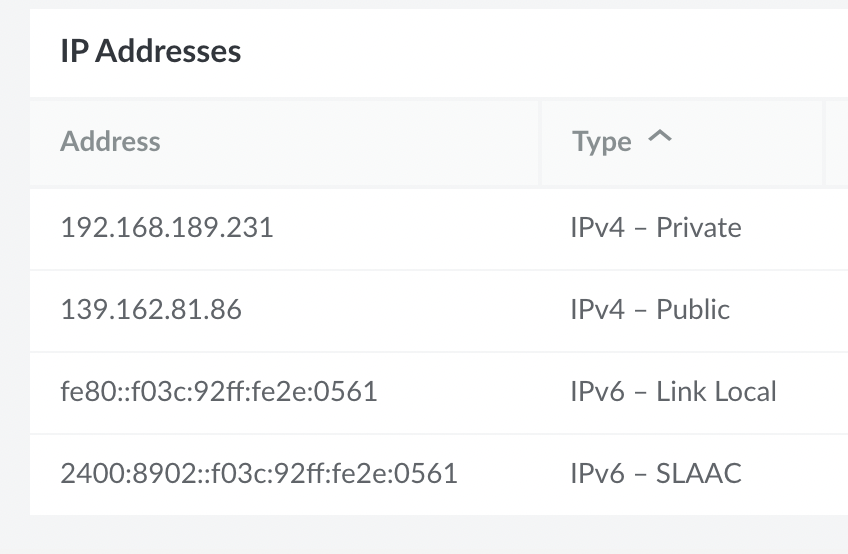
IPアドレスには、上記のIPが割り当てられました。
ローカルIPも含まれるので少々ややこしいですが、IPv4、IPv6の両方が1つずつ割り当てられています。
ssh接続
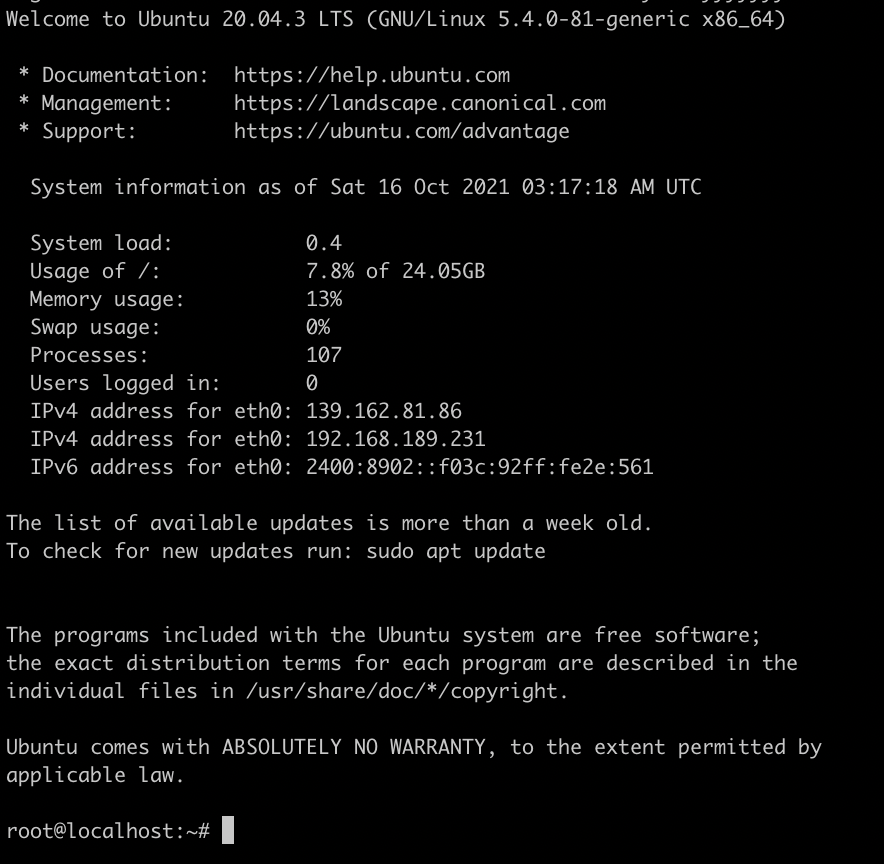
初期ユーザーはrootでした。パスワード認証もできてしまうので、少し不安です。
ホストネームもlocalhostとなっていて、ちょっと気になってしまいます。
見た目は通常のUbuntu Serverと同じで、特にMOTDが加工されているといったこともなさそうです。
回線スピード
グローバル
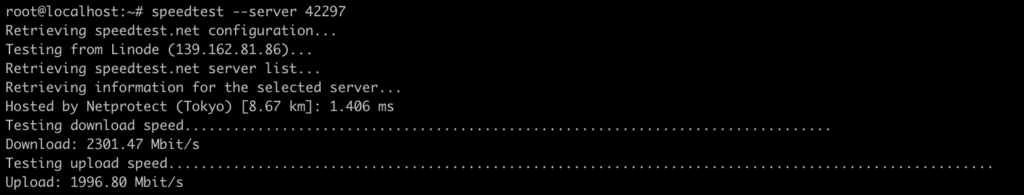
最も早いところで約2Gbpsという結果になりました。
実際はもう少しスピードが出るものと思われますが、現状だとこれが限界のようです。
ローカル
Linodeを2台借りて、2台間のデータ転送の速度を測定します。
10GBのデータを作成して、HTTP経由での転送速度で測定しています。
root@localhost:~# wget 192.168.150.53/test10G
--2021-10-20 05:30:47-- http://192.168.150.53/test10G
Connecting to 192.168.150.53:80... connected.
HTTP request sent, awaiting response... 200 OK
Length: 11230773248 (10G)
Saving to: ‘test10G’

test10G 100%[=========================================================================================================================================>] 10.46G 120MB/s in 89s

2021-10-20 05:32:16 (120 MB/s) - ‘test10G’ saved [11230773248/11230773248]
120MB/s出てくれました。
Mbpsに直すと、960Mbpsということになります。
root@localhost:~# ping 192.168.150.53
PING 192.168.150.53 (192.168.150.53) 56(84) bytes of data.
64 bytes from 192.168.150.53: icmp_seq=1 ttl=64 time=1.42 ms
64 bytes from 192.168.150.53: icmp_seq=2 ttl=64 time=0.416 ms
64 bytes from 192.168.150.53: icmp_seq=3 ttl=64 time=0.453 ms
64 bytes from 192.168.150.53: icmp_seq=4 ttl=64 time=0.437 ms
64 bytes from 192.168.150.53: icmp_seq=5 ttl=64 time=0.416 ms
64 bytes from 192.168.150.53: icmp_seq=6 ttl=64 time=0.408 ms
64 bytes from 192.168.150.53: icmp_seq=7 ttl=64 time=0.488 ms
64 bytes from 192.168.150.53: icmp_seq=8 ttl=64 time=0.517 ms
64 bytes from 192.168.150.53: icmp_seq=9 ttl=64 time=0.414 ms
64 bytes from 192.168.150.53: icmp_seq=10 ttl=64 time=0.382 ms
64 bytes from 192.168.150.53: icmp_seq=11 ttl=64 time=0.383 ms
64 bytes from 192.168.150.53: icmp_seq=12 ttl=64 time=0.365 ms
64 bytes from 192.168.150.53: icmp_seq=13 ttl=64 time=0.359 ms
64 bytes from 192.168.150.53: icmp_seq=14 ttl=64 time=0.439 ms
64 bytes from 192.168.150.53: icmp_seq=15 ttl=64 time=0.396 ms
64 bytes from 192.168.150.53: icmp_seq=16 ttl=64 time=0.421 ms
64 bytes from 192.168.150.53: icmp_seq=17 ttl=64 time=0.427 ms
64 bytes from 192.168.150.53: icmp_seq=18 ttl=64 time=0.384 ms
64 bytes from 192.168.150.53: icmp_seq=19 ttl=64 time=0.415 ms
64 bytes from 192.168.150.53: icmp_seq=20 ttl=64 time=0.424 ms
^C
--- 192.168.150.53 ping statistics ---
20 packets transmitted, 20 received, 0% packet loss, time 19419ms
rtt min/avg/max/mdev = 0.359/0.468/1.422/0.221 ms
pingは0.468msでした。
CPU
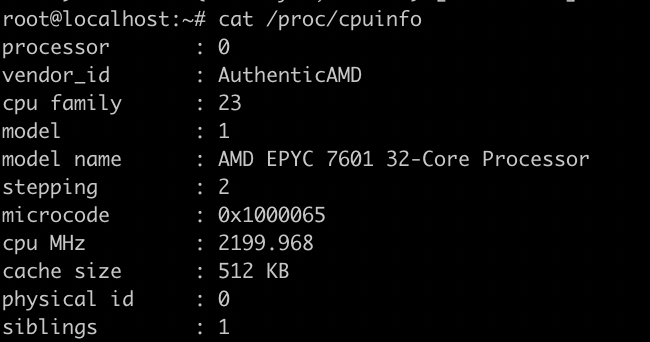
今回のサーバーには、AMDのEPYC 7601が割り当てられていました。周波数は2.2GHzのようです。
UnixBench
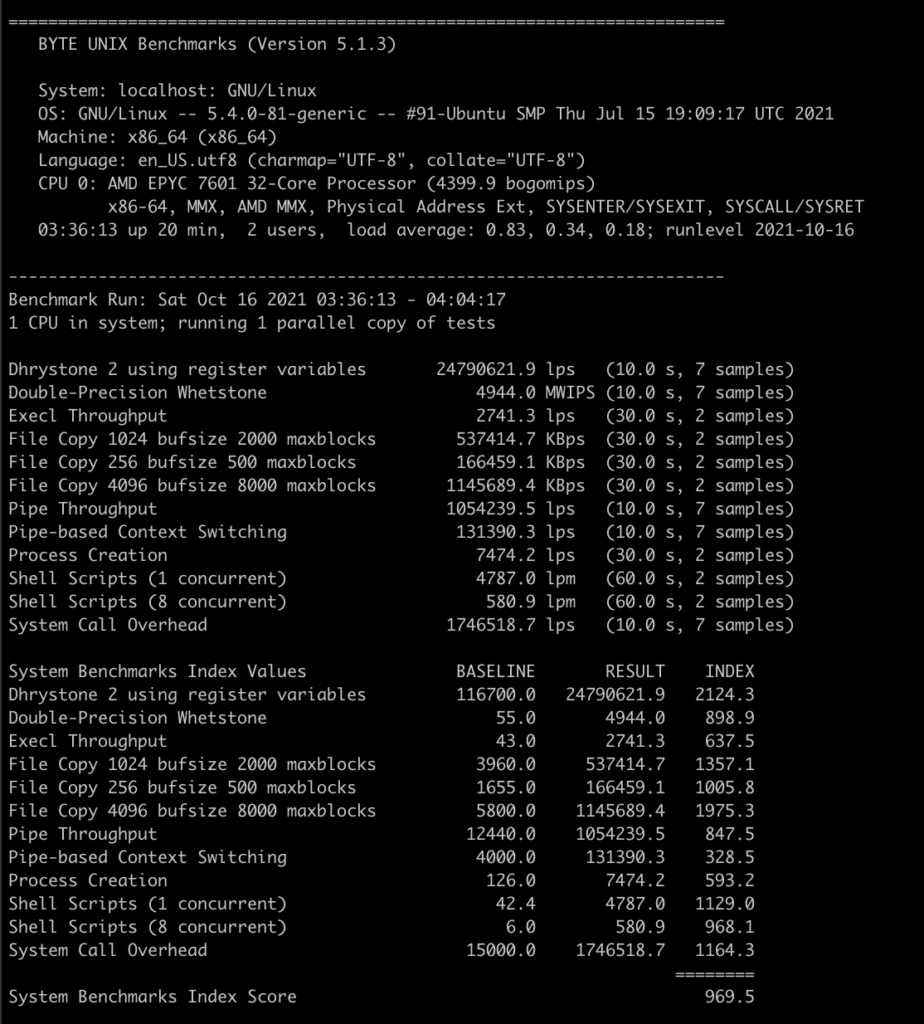
スコアは969となりました。
計測中のstealは0.3%でした。
Sysbench(CPU)
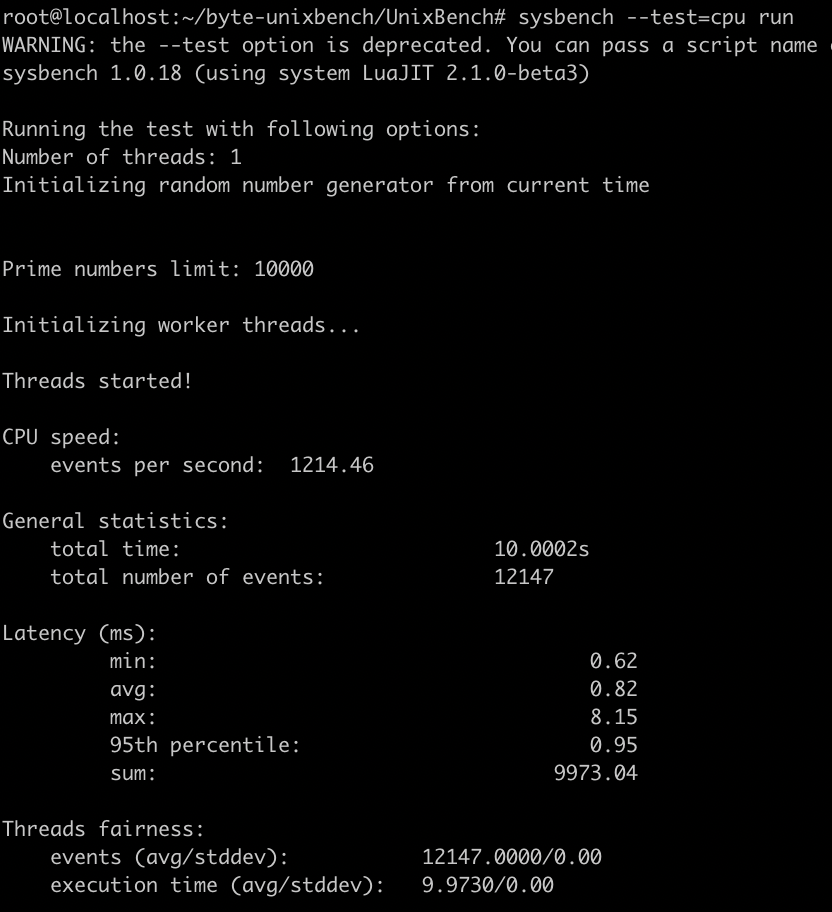
CPUスコアは1214でした。
計測中のstealは0.0%でした。
ディスク
ディスクの測定には、fioを使用しています。
シーケンシャルリード
root@localhost:~# fio -filename=/tmp/test2g -direct=1 -rw=read -bs=4k -size=2G -numjobs=64 -runtime=10 -group_reporting -name=file1
file1: (g=0): rw=read, bs=(R) 4096B-4096B, (W) 4096B-4096B, (T) 4096B-4096B, ioengine=psync, iodepth=1
...
fio-3.16
Starting 64 processes
Jobs: 64 (f=64): [R(64)][100.0%][r=74.7MiB/s][r=19.1k IOPS][eta 00m:00s]
file1: (groupid=0, jobs=64): err= 0: pid=1834: Wed Oct 20 04:19:09 2021
read: IOPS=30.4k, BW=119MiB/s (125MB/s)(1195MiB/10045msec)
clat (usec): min=55, max=202375, avg=2090.66, stdev=3398.47
lat (usec): min=55, max=202376, avg=2090.97, stdev=3398.53
clat percentiles (usec):
| 1.00th=[ 135], 5.00th=[ 351], 10.00th=[ 734], 20.00th=[ 1139],
| 30.00th=[ 1319], 40.00th=[ 1483], 50.00th=[ 1647], 60.00th=[ 1827],
| 70.00th=[ 2040], 80.00th=[ 2376], 90.00th=[ 2999], 95.00th=[ 4047],
| 99.00th=[ 13960], 99.50th=[ 15795], 99.90th=[ 46924], 99.95th=[ 71828],
| 99.99th=[113771]
bw ( KiB/s): min=40447, max=189953, per=98.80%, avg=120342.22, stdev=587.91, samples=1263
iops : min=10102, max=47474, avg=30069.22, stdev=146.93, samples=1263
lat (usec) : 100=0.28%, 250=3.23%, 500=3.38%, 750=3.40%, 1000=4.99%
lat (msec) : 2=52.91%, 4=26.74%, 10=3.34%, 20=1.48%, 50=0.17%
lat (msec) : 100=0.06%, 250=0.03%
cpu : usr=0.34%, sys=0.94%, ctx=306848, majf=0, minf=849
IO depths : 1=100.0%, 2=0.0%, 4=0.0%, 8=0.0%, 16=0.0%, 32=0.0%, >=64=0.0%
submit : 0=0.0%, 4=100.0%, 8=0.0%, 16=0.0%, 32=0.0%, 64=0.0%, >=64=0.0%
complete : 0=0.0%, 4=100.0%, 8=0.0%, 16=0.0%, 32=0.0%, 64=0.0%, >=64=0.0%
issued rwts: total=305869,0,0,0 short=0,0,0,0 dropped=0,0,0,0
latency : target=0, window=0, percentile=100.00%, depth=1

Run status group 0 (all jobs):
READ: bw=119MiB/s (125MB/s), 119MiB/s-119MiB/s (125MB/s-125MB/s), io=1195MiB (1253MB), run=10045-10045msec

Disk stats (read/write):
sda: ios=301480/30, merge=0/0, ticks=358353/15, in_queue=89936, util=98.27%
125MB/sほど出ているようです。早い!と言えるほどではありませんが、十分ではあると思います。
シーケンシャルライト
root@localhost:~# fio -filename=/tmp/test2g -direct=1 -rw=write -bs=4k -size=2G -numjobs=64 -runtime=10 -group_reporting -name=file1
file1: (g=0): rw=write, bs=(R) 4096B-4096B, (W) 4096B-4096B, (T) 4096B-4096B, ioengine=psync, iodepth=1
...
fio-3.16
Starting 64 processes
Jobs: 64 (f=64): [W(64)][100.0%][w=1955KiB/s][w=488 IOPS][eta 00m:00s]
file1: (groupid=0, jobs=64): err= 0: pid=2469: Wed Oct 20 04:47:54 2021
write: IOPS=489, BW=1957KiB/s (2004kB/s)(19.3MiB/10106msec); 0 zone resets
clat (usec): min=68, max=313554, avg=130298.02, stdev=131135.03
lat (usec): min=68, max=313554, avg=130299.00, stdev=131134.70
clat percentiles (usec):
| 1.00th=[ 86], 5.00th=[ 99], 10.00th=[ 109], 20.00th=[ 123],
| 30.00th=[ 145], 40.00th=[ 200], 50.00th=[ 78119], 60.00th=[252707],
| 70.00th=[258999], 80.00th=[263193], 90.00th=[270533], 95.00th=[283116],
| 99.00th=[304088], 99.50th=[308282], 99.90th=[312476], 99.95th=[312476],
| 99.99th=[312476]
bw ( KiB/s): min= 966, max= 2563, per=97.11%, avg=1900.52, stdev= 7.91, samples=1279
iops : min= 198, max= 622, avg=437.72, stdev= 2.01, samples=1279
lat (usec) : 100=5.78%, 250=38.32%, 500=3.44%, 750=0.44%, 1000=0.47%
lat (msec) : 2=0.67%, 4=0.32%, 10=0.10%, 20=0.06%, 50=0.16%
lat (msec) : 100=0.53%, 250=5.95%, 500=43.76%
cpu : usr=0.00%, sys=1.39%, ctx=9935, majf=0, minf=788
IO depths : 1=100.0%, 2=0.0%, 4=0.0%, 8=0.0%, 16=0.0%, 32=0.0%, >=64=0.0%
submit : 0=0.0%, 4=100.0%, 8=0.0%, 16=0.0%, 32=0.0%, 64=0.0%, >=64=0.0%
complete : 0=0.0%, 4=100.0%, 8=0.0%, 16=0.0%, 32=0.0%, 64=0.0%, >=64=0.0%
issued rwts: total=0,4945,0,0 short=0,0,0,0 dropped=0,0,0,0
latency : target=0, window=0, percentile=100.00%, depth=1

Run status group 0 (all jobs):
WRITE: bw=1957KiB/s (2004kB/s), 1957KiB/s-1957KiB/s (2004kB/s-2004kB/s), io=19.3MiB (20.3MB), run=10106-10106msec

Disk stats (read/write):
sda: ios=0/4893, merge=0/3, ticks=0/1108, in_queue=72, util=93.42%
2MB/sほどしか出てくれませんでした。ただ、CPUが100%になってしまっていたので、CPUがボトルネックになってしまっていたかもしれません。
root@localhost:~# fio -filename=/tmp/test2g -direct=1 -rw=write -bs=64k -size=2G -numjobs=64 -runtime=10 -group_reporting -name=file1
file1: (g=0): rw=write, bs=(R) 64.0KiB-64.0KiB, (W) 64.0KiB-64.0KiB, (T) 64.0KiB-64.0KiB, ioengine=psync, iodepth=1
...
fio-3.16
Starting 64 processes
Jobs: 64 (f=64): [W(64)][100.0%][w=30.7MiB/s][w=490 IOPS][eta 00m:00s]
file1: (groupid=0, jobs=64): err= 0: pid=2834: Wed Oct 20 04:50:51 2021
write: IOPS=485, BW=30.3MiB/s (31.8MB/s)(306MiB/10101msec); 0 zone resets
clat (usec): min=82, max=331995, avg=131330.90, stdev=132293.12
lat (usec): min=85, max=331998, avg=131333.76, stdev=132292.44
clat percentiles (usec):
| 1.00th=[ 94], 5.00th=[ 104], 10.00th=[ 114], 20.00th=[ 130],
| 30.00th=[ 149], 40.00th=[ 198], 50.00th=[ 93848], 60.00th=[254804],
| 70.00th=[256902], 80.00th=[261096], 90.00th=[274727], 95.00th=[295699],
| 99.00th=[325059], 99.50th=[329253], 99.90th=[333448], 99.95th=[333448],
| 99.99th=[333448]
bw ( KiB/s): min=16148, max=38686, per=99.11%, avg=30762.71, stdev=110.97, samples=1279
iops : min= 197, max= 579, avg=431.32, stdev= 1.74, samples=1279
lat (usec) : 100=3.14%, 250=40.54%, 500=2.39%, 750=0.76%, 1000=1.35%
lat (msec) : 2=0.69%, 4=0.29%, 10=0.12%, 20=0.06%, 50=0.20%
lat (msec) : 100=0.51%, 250=4.53%, 500=45.42%
cpu : usr=0.00%, sys=1.40%, ctx=9829, majf=0, minf=814
IO depths : 1=100.0%, 2=0.0%, 4=0.0%, 8=0.0%, 16=0.0%, 32=0.0%, >=64=0.0%
submit : 0=0.0%, 4=100.0%, 8=0.0%, 16=0.0%, 32=0.0%, 64=0.0%, >=64=0.0%
complete : 0=0.0%, 4=100.0%, 8=0.0%, 16=0.0%, 32=0.0%, 64=0.0%, >=64=0.0%
issued rwts: total=0,4899,0,0 short=0,0,0,0 dropped=0,0,0,0
latency : target=0, window=0, percentile=100.00%, depth=1

Run status group 0 (all jobs):
WRITE: bw=30.3MiB/s (31.8MB/s), 30.3MiB/s-30.3MiB/s (31.8MB/s-31.8MB/s), io=306MiB (321MB), run=10101-10101msec

Disk stats (read/write):
sda: ios=0/4749, merge=0/1, ticks=0/1139, in_queue=104, util=95.29%
試しにブロックサイズを上げて測ってみたところ、速度の向上が確認できました。
ただし、IOPSに関しては変化を感じられなかったため、容量の少ないファイルを大量に書き込む場合には適さないかと思われます。
ランダムリード
root@localhost:~# fio -filename=/tmp/test2g -direct=1 -rw=randread -bs=4k -size=2G -numjobs=64 -runtime=10 -group_reporting -name=file1
file1: (g=0): rw=randread, bs=(R) 4096B-4096B, (W) 4096B-4096B, (T) 4096B-4096B, ioengine=psync, iodepth=1
...
fio-3.16
Starting 64 processes
Jobs: 64 (f=64): [r(64)][100.0%][r=133MiB/s][r=34.1k IOPS][eta 00m:00s]
file1: (groupid=0, jobs=64): err= 0: pid=2916: Wed Oct 20 04:53:33 2021
read: IOPS=31.1k, BW=121MiB/s (127MB/s)(1217MiB/10023msec)
clat (usec): min=143, max=298813, avg=2050.38, stdev=1372.43
lat (usec): min=143, max=298814, avg=2050.73, stdev=1372.82
clat percentiles (usec):
| 1.00th=[ 334], 5.00th=[ 906], 10.00th=[ 1172], 20.00th=[ 1418],
| 30.00th=[ 1598], 40.00th=[ 1762], 50.00th=[ 1909], 60.00th=[ 2073],
| 70.00th=[ 2278], 80.00th=[ 2540], 90.00th=[ 2933], 95.00th=[ 3392],
| 99.00th=[ 5211], 99.50th=[ 6915], 99.90th=[16712], 99.95th=[23200],
| 99.99th=[31589]
bw ( KiB/s): min=94254, max=154905, per=99.17%, avg=123266.56, stdev=233.28, samples=1255
iops : min=23547, max=38708, avg=30803.71, stdev=58.24, samples=1255
lat (usec) : 250=0.42%, 500=1.64%, 750=1.60%, 1000=2.54%
lat (msec) : 2=49.29%, 4=42.14%, 10=2.09%, 20=0.20%, 50=0.08%
lat (msec) : 100=0.01%, 250=0.01%, 500=0.01%
cpu : usr=0.46%, sys=0.91%, ctx=312187, majf=0, minf=758
IO depths : 1=100.0%, 2=0.0%, 4=0.0%, 8=0.0%, 16=0.0%, 32=0.0%, >=64=0.0%
submit : 0=0.0%, 4=100.0%, 8=0.0%, 16=0.0%, 32=0.0%, 64=0.0%, >=64=0.0%
complete : 0=0.0%, 4=100.0%, 8=0.0%, 16=0.0%, 32=0.0%, 64=0.0%, >=64=0.0%
issued rwts: total=311453,0,0,0 short=0,0,0,0 dropped=0,0,0,0
latency : target=0, window=0, percentile=100.00%, depth=1

Run status group 0 (all jobs):
READ: bw=121MiB/s (127MB/s), 121MiB/s-121MiB/s (127MB/s-127MB/s), io=1217MiB (1276MB), run=10023-10023msec

Disk stats (read/write):
sda: ios=308066/54, merge=0/9, ticks=348646/35, in_queue=9028, util=98.61%
シーケンシャルリードと比べ、ほとんど差がない結果となりました。
理由は分かりませんが、おそらく元々早いSSDが使われていて、ランダムリードでもテスト環境では差がわからないほどの速度が出ていることかと思われます。
ランダムライト
root@localhost:~# fio -filename=/tmp/test2g -direct=1 -rw=randwrite -bs=4k -size=2G -numjobs=64 -runtime=10 -group_reporting -name=file1
file1: (g=0): rw=randwrite, bs=(R) 4096B-4096B, (W) 4096B-4096B, (T) 4096B-4096B, ioengine=psync, iodepth=1
...
fio-3.16
Starting 64 processes
Jobs: 64 (f=64): [w(64)][100.0%][w=1972KiB/s][w=493 IOPS][eta 00m:00s]
file1: (groupid=0, jobs=64): err= 0: pid=3084: Wed Oct 20 04:59:24 2021
write: IOPS=500, BW=2000KiB/s (2048kB/s)(19.8MiB/10128msec); 0 zone resets
clat (usec): min=73, max=276173, avg=127315.32, stdev=127861.32
lat (usec): min=74, max=276173, avg=127316.13, stdev=127861.01
clat percentiles (usec):
| 1.00th=[ 81], 5.00th=[ 89], 10.00th=[ 97], 20.00th=[ 110],
| 30.00th=[ 123], 40.00th=[ 149], 50.00th=[ 88605], 60.00th=[254804],
| 70.00th=[256902], 80.00th=[256902], 90.00th=[263193], 95.00th=[270533],
| 99.00th=[274727], 99.50th=[274727], 99.90th=[274727], 99.95th=[274727],
| 99.99th=[274727]
bw ( KiB/s): min= 974, max= 2513, per=97.24%, avg=1944.72, stdev= 6.33, samples=1279
iops : min= 200, max= 605, avg=444.78, stdev= 1.60, samples=1279
lat (usec) : 100=12.32%, 250=34.85%, 500=1.46%, 750=0.20%, 1000=0.26%
lat (msec) : 2=0.32%, 4=0.02%, 20=0.08%, 50=0.16%, 100=0.59%
lat (msec) : 250=3.14%, 500=46.60%
cpu : usr=0.00%, sys=1.45%, ctx=10141, majf=0, minf=673
IO depths : 1=100.0%, 2=0.0%, 4=0.0%, 8=0.0%, 16=0.0%, 32=0.0%, >=64=0.0%
submit : 0=0.0%, 4=100.0%, 8=0.0%, 16=0.0%, 32=0.0%, 64=0.0%, >=64=0.0%
complete : 0=0.0%, 4=100.0%, 8=0.0%, 16=0.0%, 32=0.0%, 64=0.0%, >=64=0.0%
issued rwts: total=0,5064,0,0 short=0,0,0,0 dropped=0,0,0,0
latency : target=0, window=0, percentile=100.00%, depth=1

Run status group 0 (all jobs):
WRITE: bw=2000KiB/s (2048kB/s), 2000KiB/s-2000KiB/s (2048kB/s-2048kB/s), io=19.8MiB (20.7MB), run=10128-10128msec

Disk stats (read/write):
sda: ios=0/5026, merge=0/2, ticks=0/883, in_queue=56, util=97.92%
ランダムライトでも、シーケンシャルと同様、IOPSが伸び悩む結果となりました。
おそらくLinodeではディスクに対して何かしらの特別な対応を施しているのかもしれません。
私にはわからない領域なので、誰か教えてください。
総評
価格にしてはとても良いサービスが提供されているように感じました。
特にDDoS保護が提供されていることに関しては、どの程度防いでくれるのかは分かりませんが、提供されているだけでも優秀であると思います。
転送量もサーバー全体で共有なので、サーバーごとに心配する必要がなくなるのもGood。
UIは全て英語なので、英語がわからない方にはちょっと戸惑うかもしれません。